 An official website of the United States government
Out-of-Pocket Spending on Complementary Health Approaches: Adults vs. Children
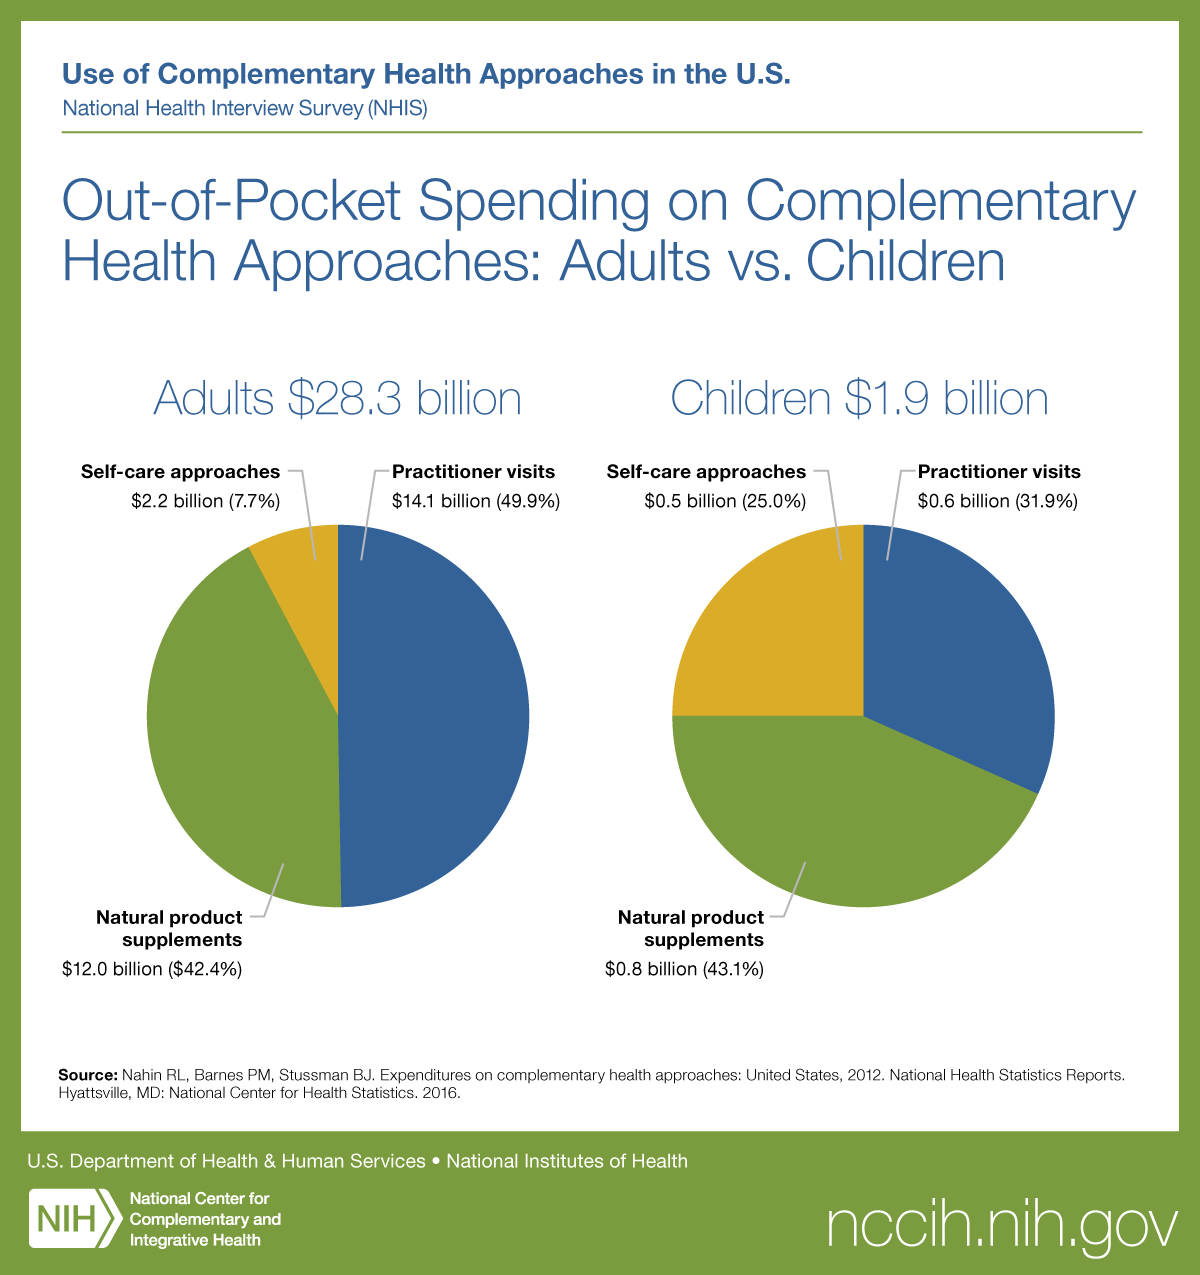
A pie graph titled ‘Adults $28.3 billion’ has three pieces:
- Self-care approaches—$2.2 billion (7.7%)
- Practitioner visits—$14.1 billion (49.9%)
- Natural product supplements—$12.0 billion ($42.4%)
A pie graph titled ‘Children $1.9 billion’ has three pieces:
- Natural product supplements—$0.8 billion (43.1%)
- Self-care approaches—$0.5 billion (25.0%)
- Practitioner visits—$0.6 billion (31.9%)
Citation: Nahin RL, Barnes PM, Stussman BJ. Expenditures on complementary health approaches: United States, 2012. (433KB PDF) National Health Statistics Reports. Hyattsville, MD: National Center for Health Statistics. 2016.