 An official website of the United States government
Graph titled Severe Pain by Age: Veterans vs Nonveterans [text version]
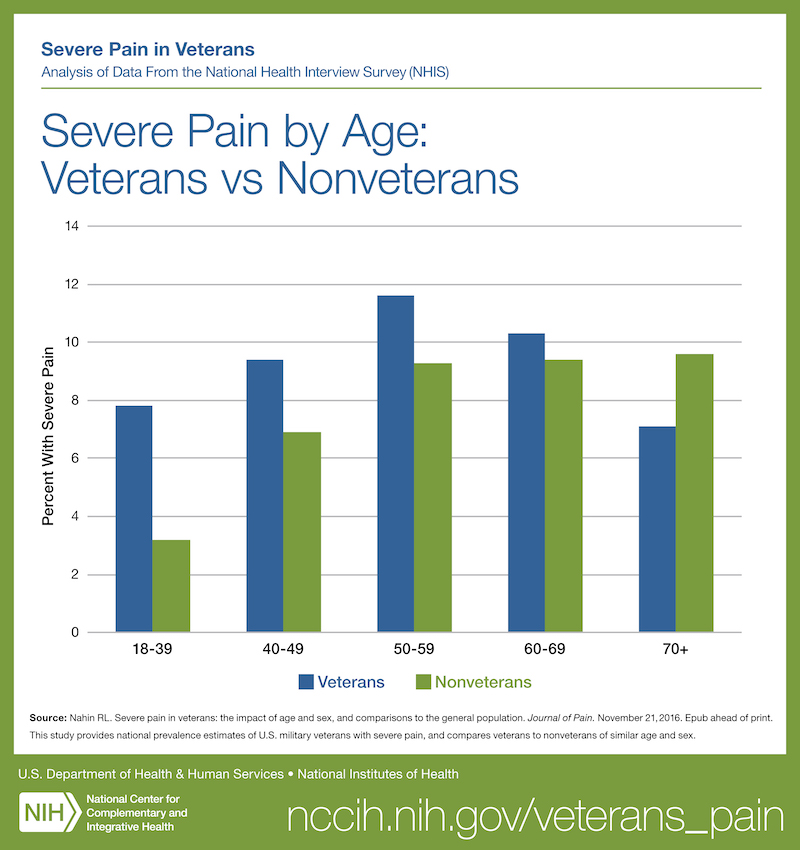
Vertical bar graph showing the percentage of veterans and nonveterans in different age groups with severe pain.
Age 18 to 39: 7.8 percent of veterans and 3.2 percent of nonveterans.
Age 40 to 49: 9.4 percent of veterans and 6.9 percent of nonveterans.
Age 50 to 59: 11.6 percent of veterans and 9.3 percent of nonveterans.
Age 60 to 69: 10.3 percent of veterans and 9.4 percent of nonveterans.
Age 70+: 7.1 percent of veterans and 9.6 percent of nonveterans.
Source
- Nahin RL. Severe pain in veterans: the impact of age and sex, and comparisons to the general population. Journal of Pain. November 21, 2016. Epub ahead of print. This study provides national prevalence of U.S. military veterans with severe pain, and compares veterans to nonveterans of similar age and sex.